Books
Blog
Bootcamps
Data Science Hub
See TOP-10 tutorials
For women
For Kids
For Black
Motivational
Waymo Data Scientist interview
04/04/2023
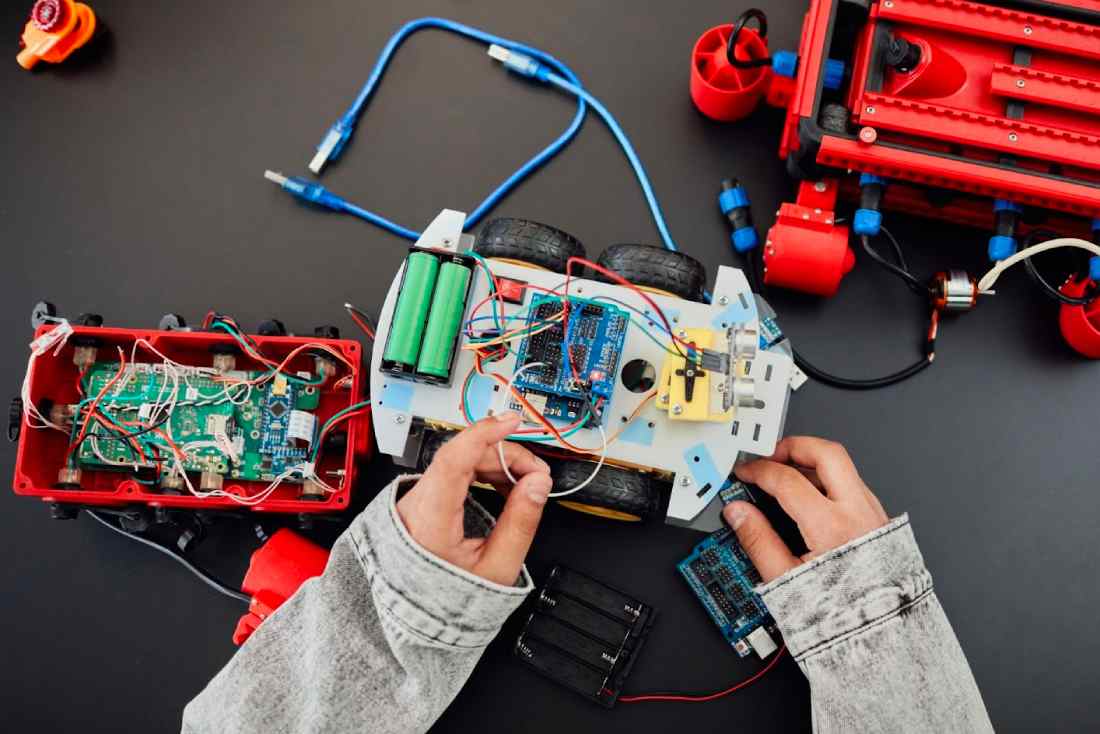
What is intelligent electronic device?
03/04/2023
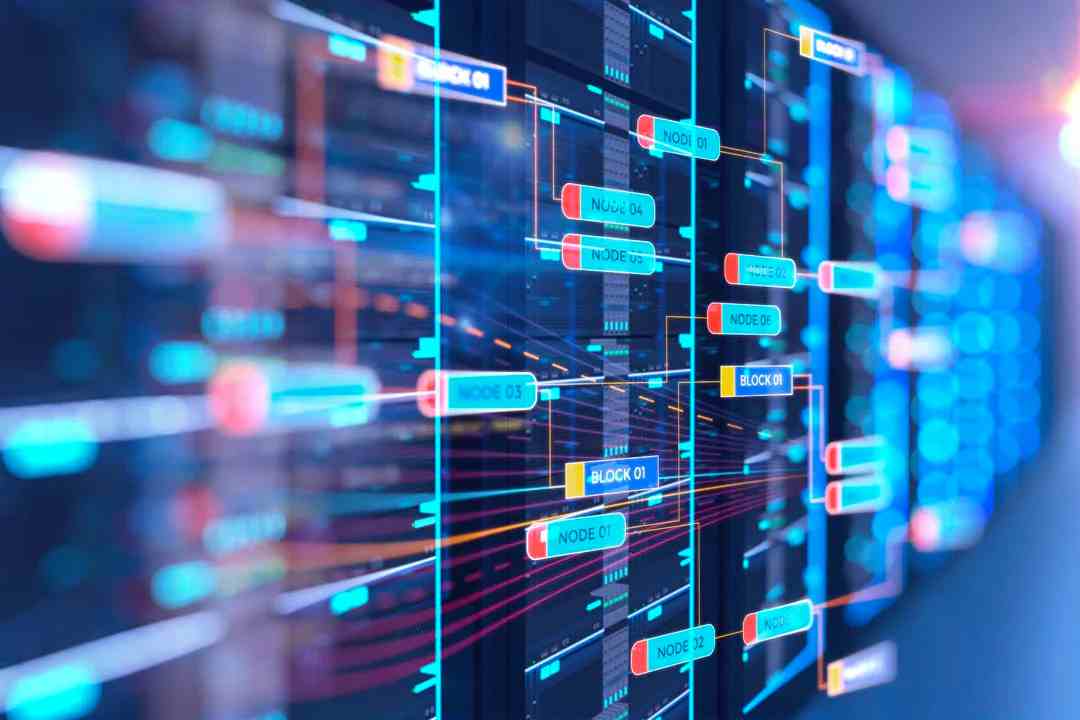
How to choose hardware for Big Data processing
15/11/2022
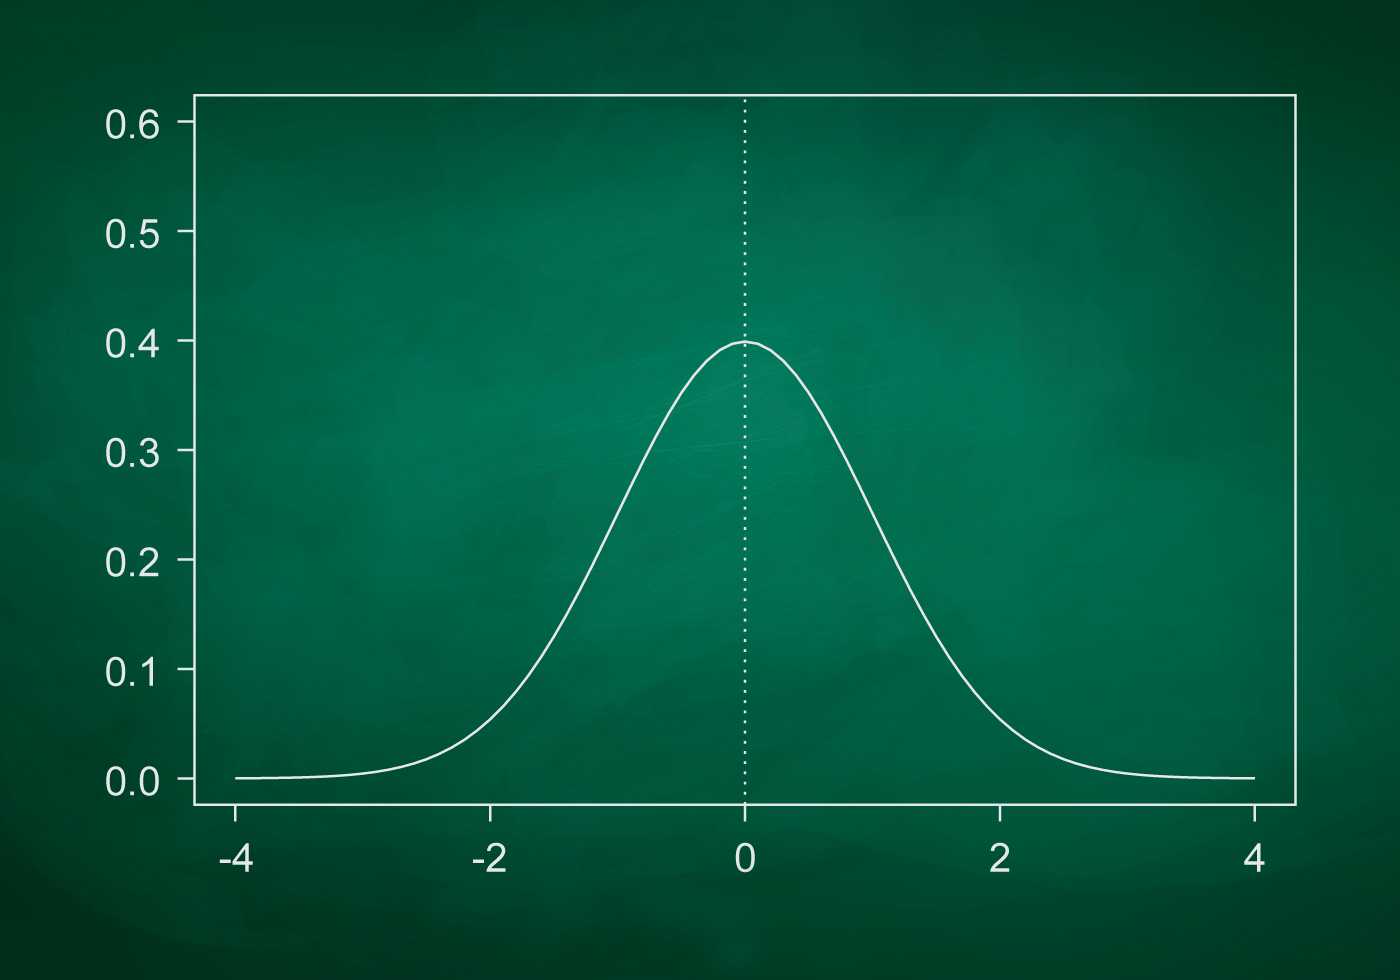
What is standard deviation definition
10/11/2022
What is Power BI and how to use it
10/11/2022
What Microsoft Azure is and how you can use it
10/11/2022
what is the definition of primary goal of editing in essay?
28/05/2022
What is ITIL 4 Foundation
13/04/2022
Best laptop for hacking
10/04/2022
Best laptops for podcasting 2022
10/04/2022
What does AI stand for
02/10/2021
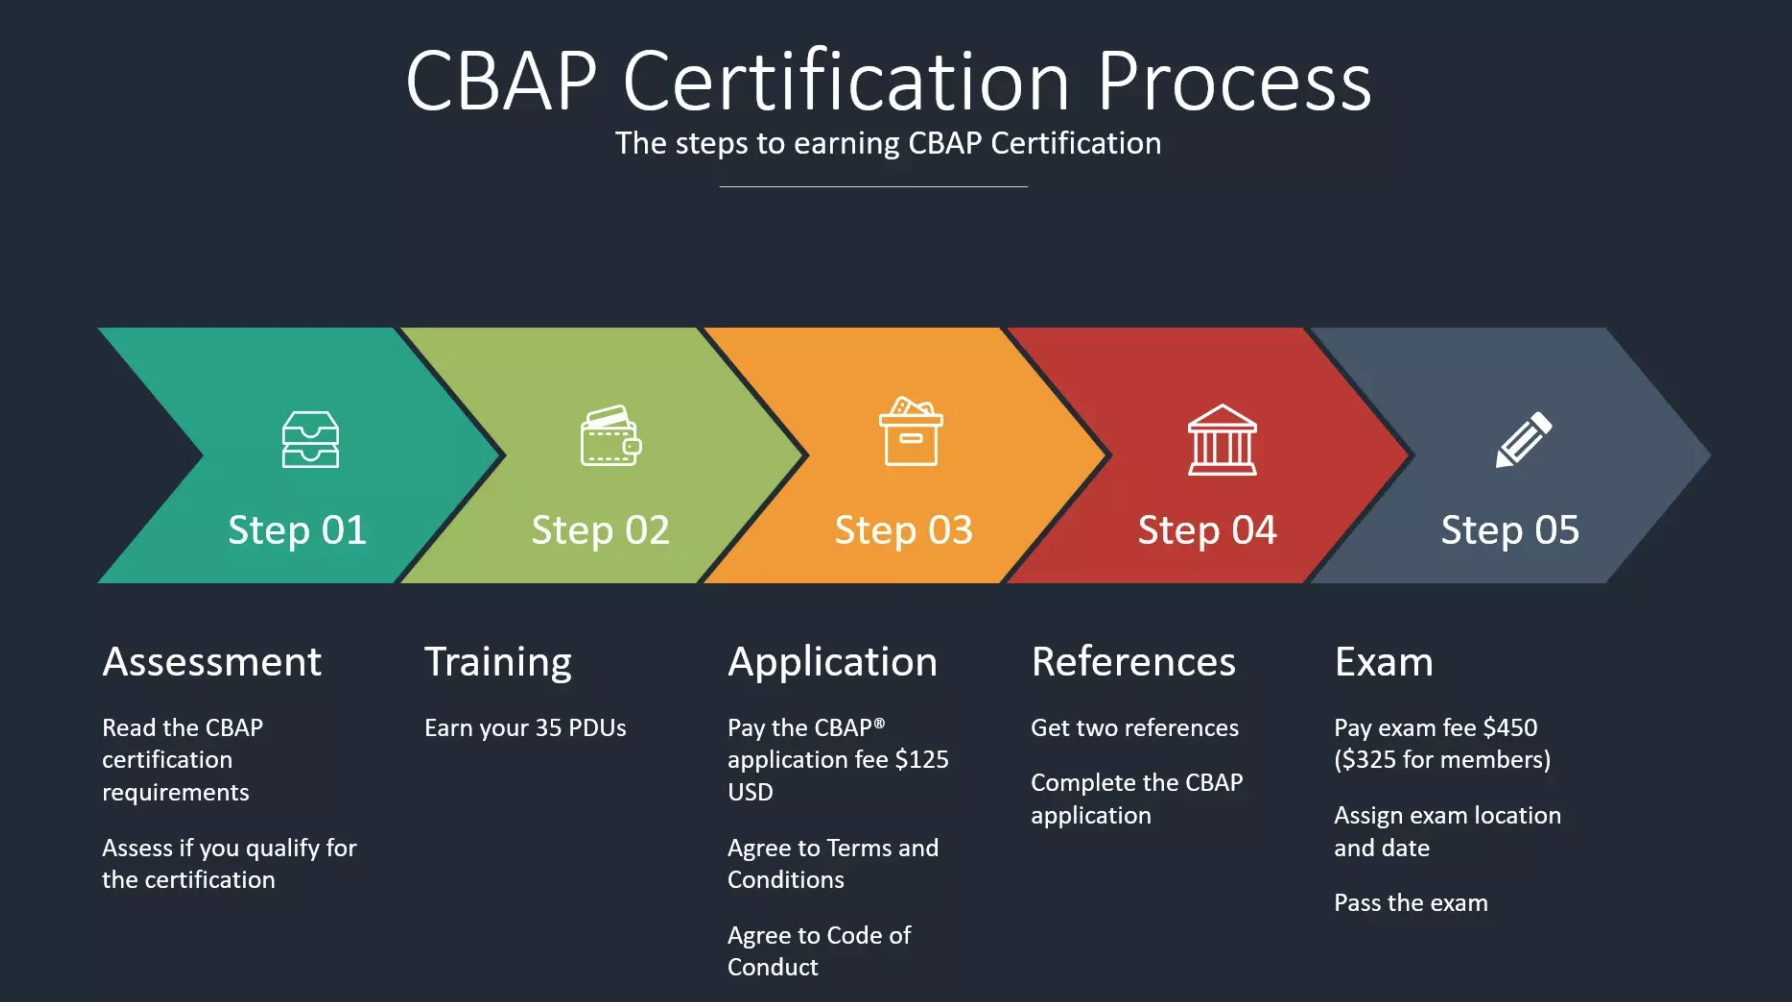
Do you need a Business Analyst Certification?
01/08/2021
GAME DESIGN, OR HOW VIRTUAL WORLDS ARE CREATED
15/07/2021
What is speech analytics?
30/05/2021
Sugar Land IT consulting services
08/04/2021
How to run official Instagram ads
06/04/2021
Mr Green to pay £3m for regulatory failures
02/04/2021
Guest posting at Big-Data.dev: become an author
14/08/2020
Generation of the game
02/04/2018
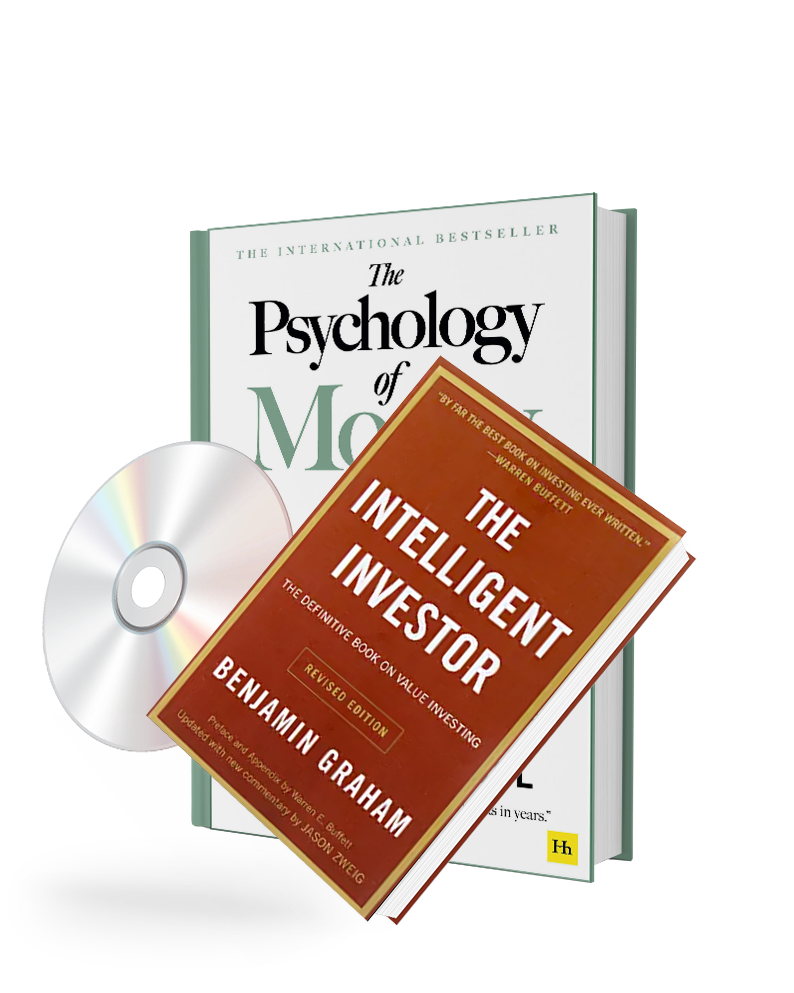
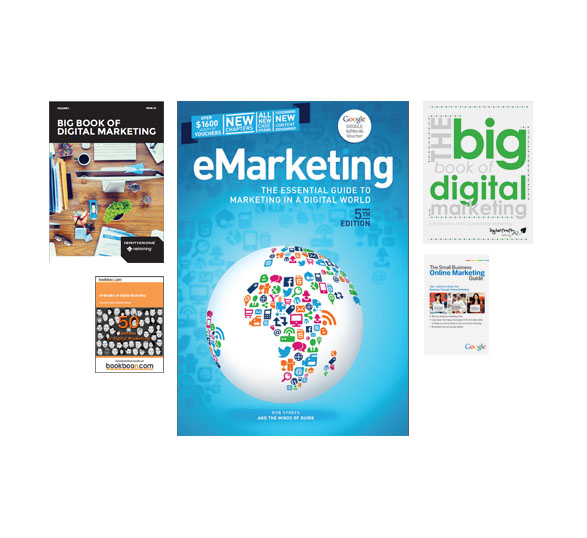
TOP 5 free e-books on Big Data Engineering
05/02/2017